Nextflow Pipeline: Results Examples#
This page showcases example results from the Nextflow pipeline for CAZyme annotation in microbiome data, demonstrating the output quality and visualization capabilities across different analysis modes.
Pipeline Overview#
The following figure illustrates the complete workflow of the Nextflow pipeline:
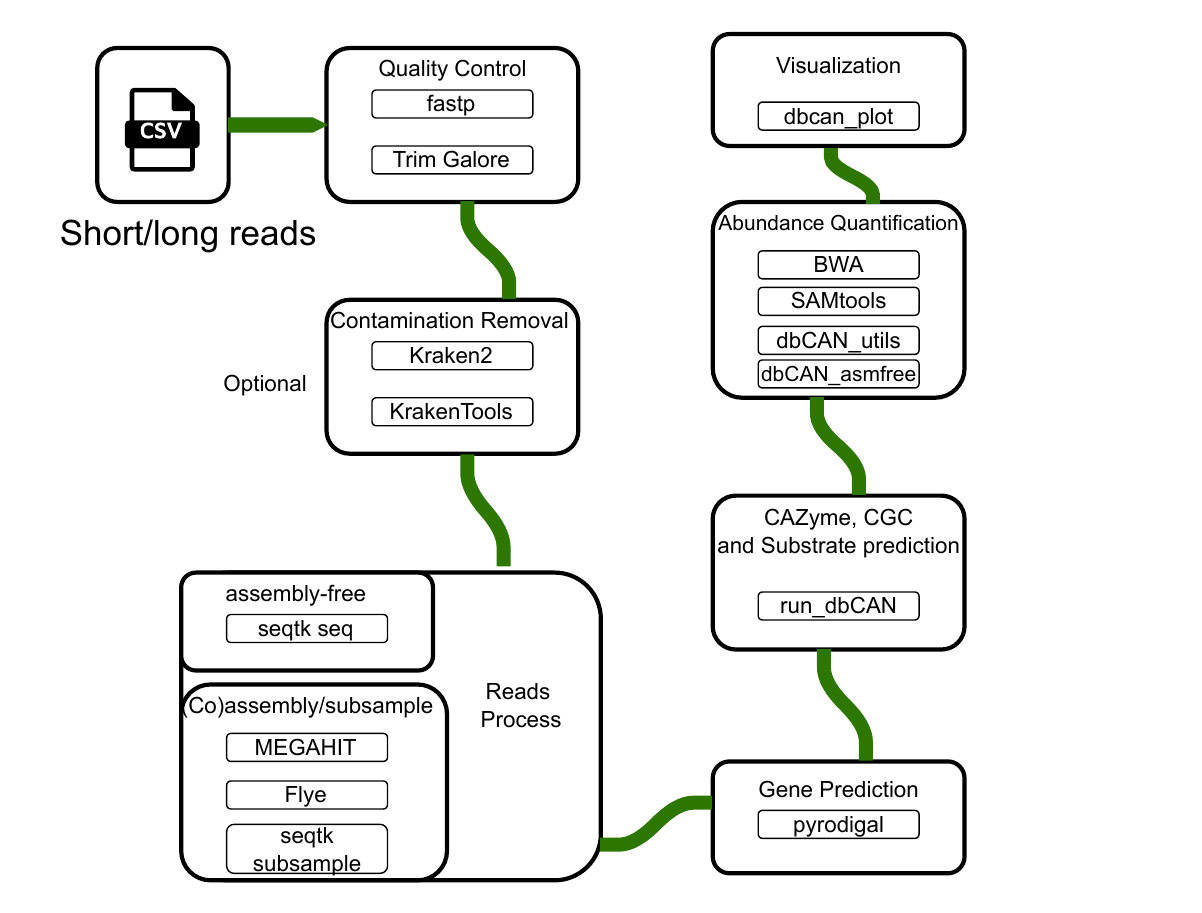
Figure S1: Complete workflow diagram of the Nextflow pipeline for CAZyme annotation in microbiome data. The pipeline supports three main modes: short reads assembly (MEGAHIT), long reads assembly (Flye), and assembly-free analysis (DIAMOND). Download PDF version.#
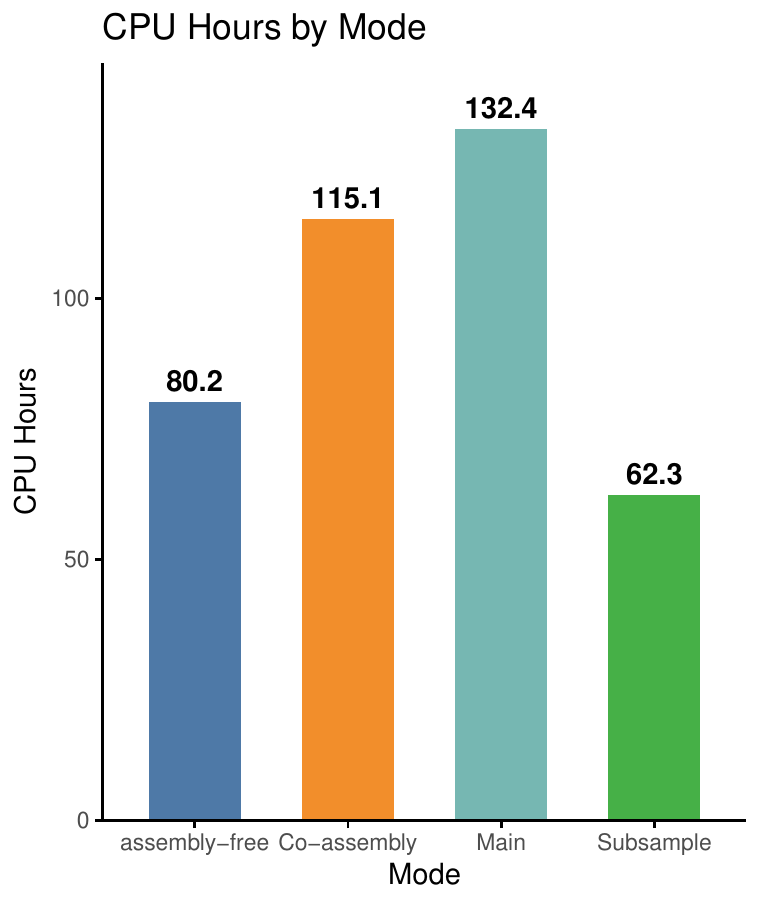
Performance Comparison#
Computational Performance#
The following figure compares the computational requirements (CPU hours) across different analysis modes:
Results Statistics#
The following figure summarizes the results statistics across different modes:

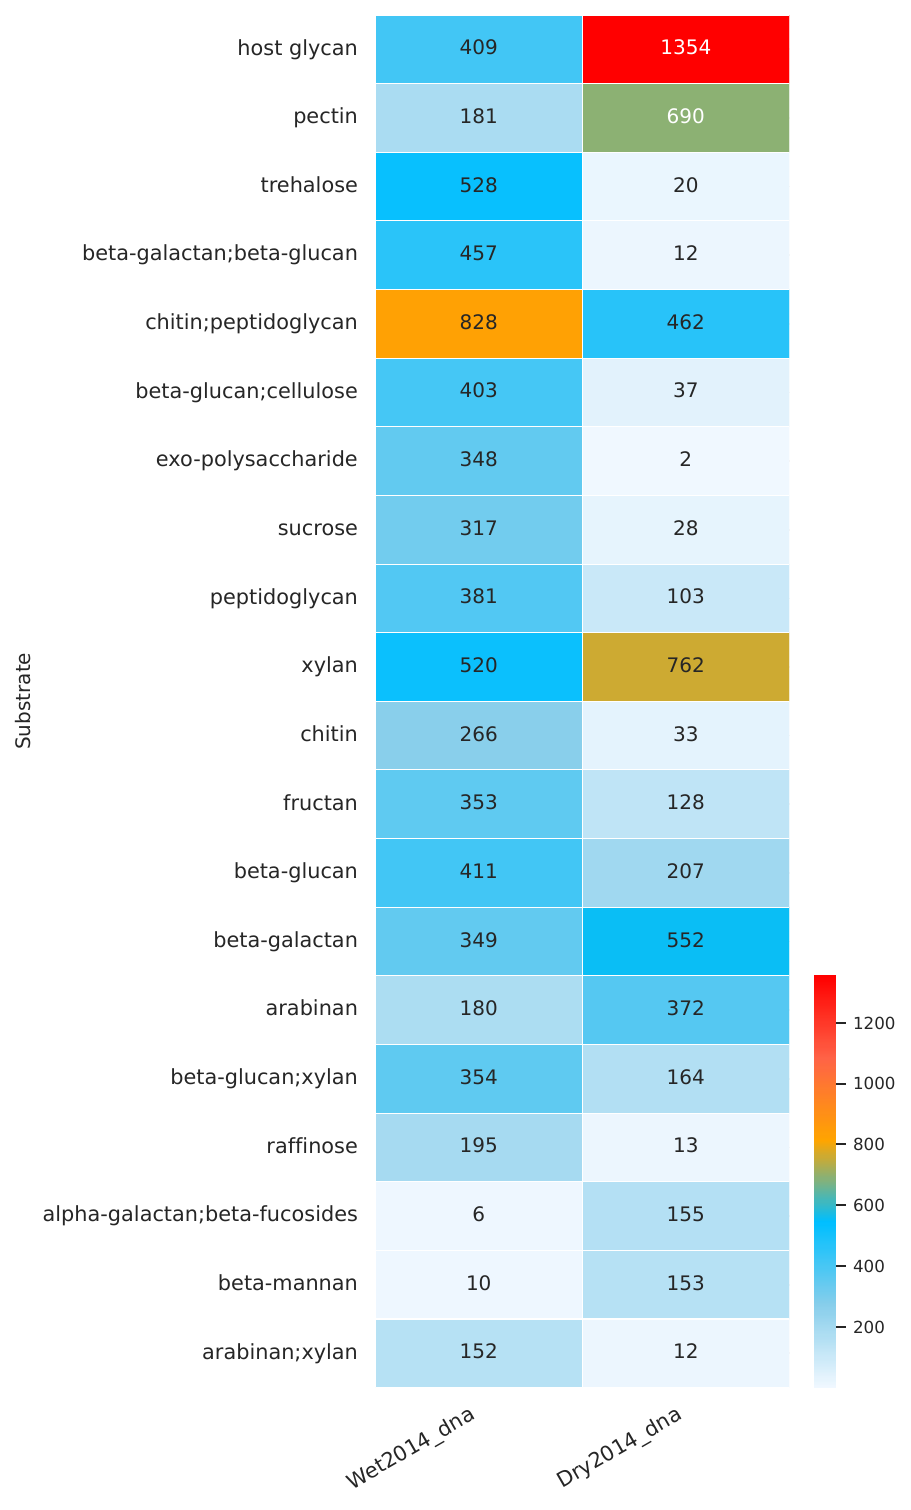
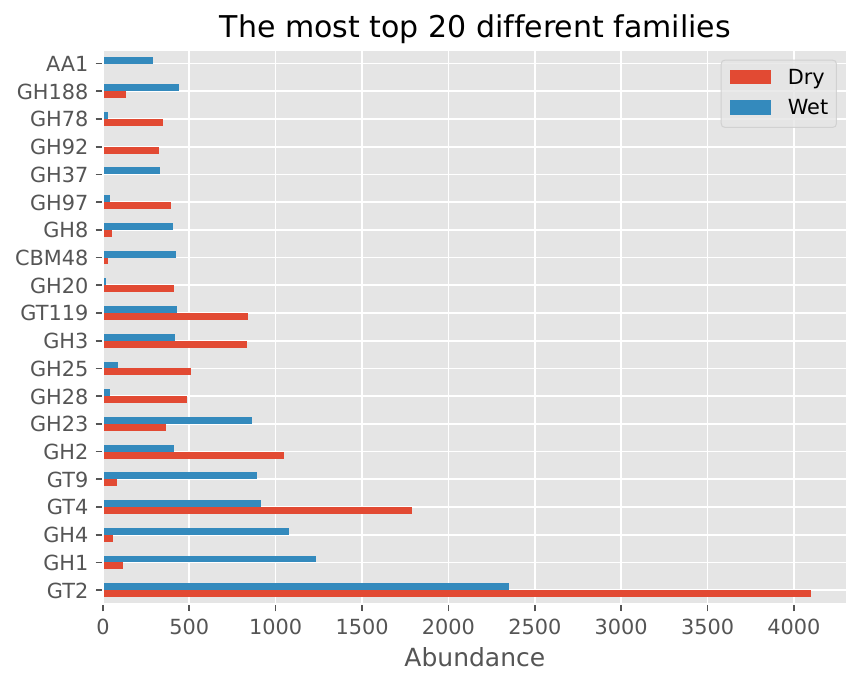
Example Results by Analysis Mode#
Short Reads Mode - Standard Analysis#
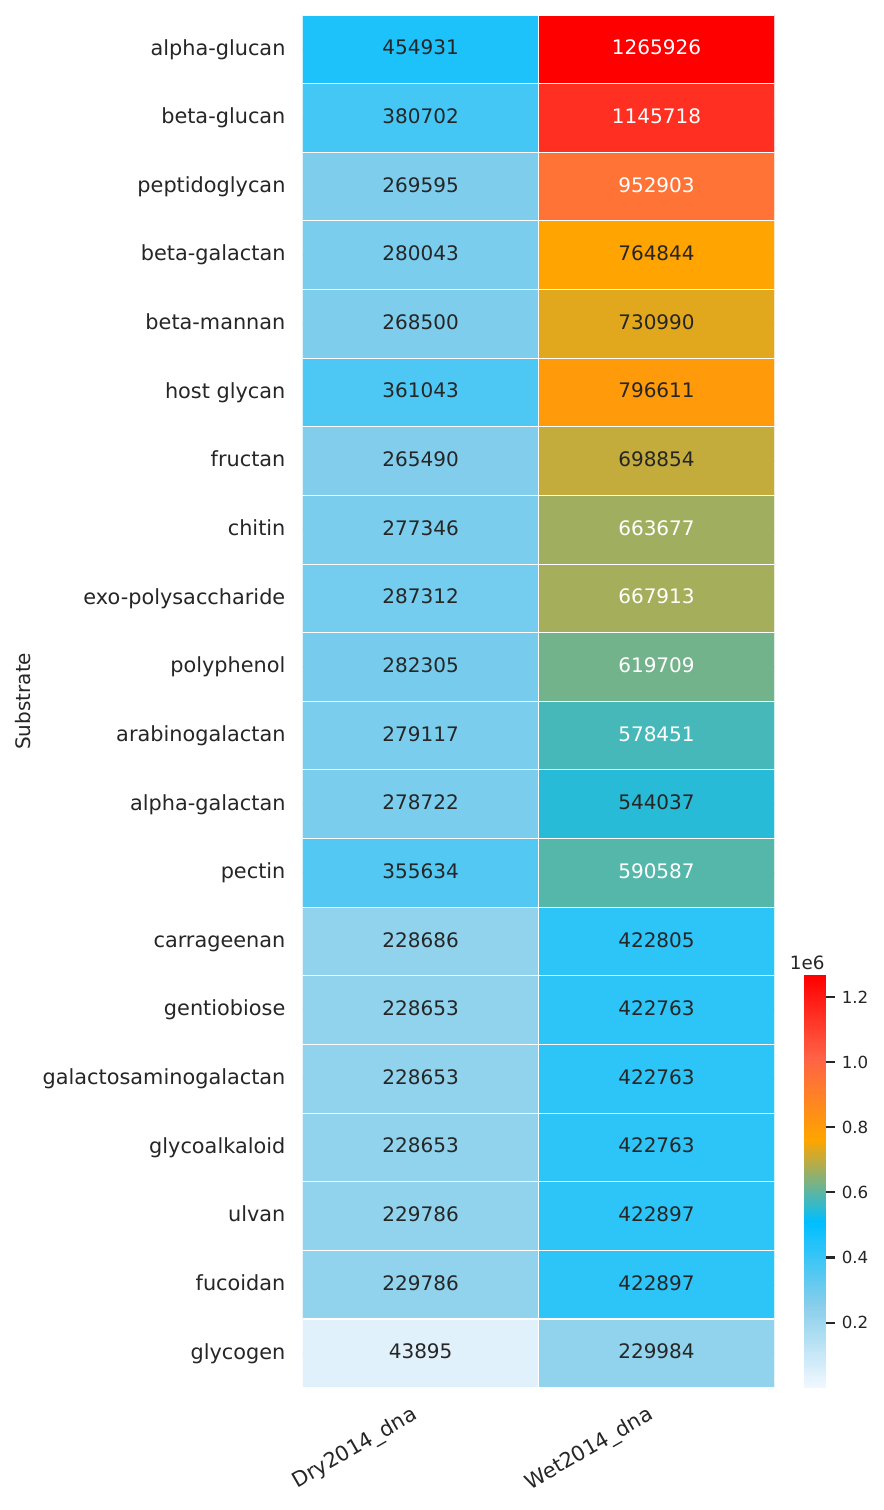
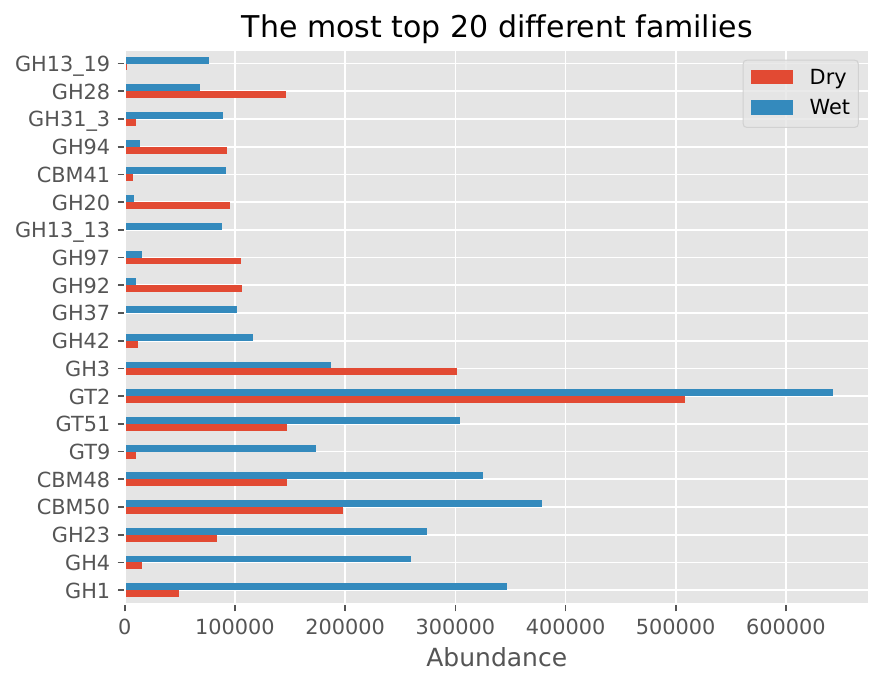
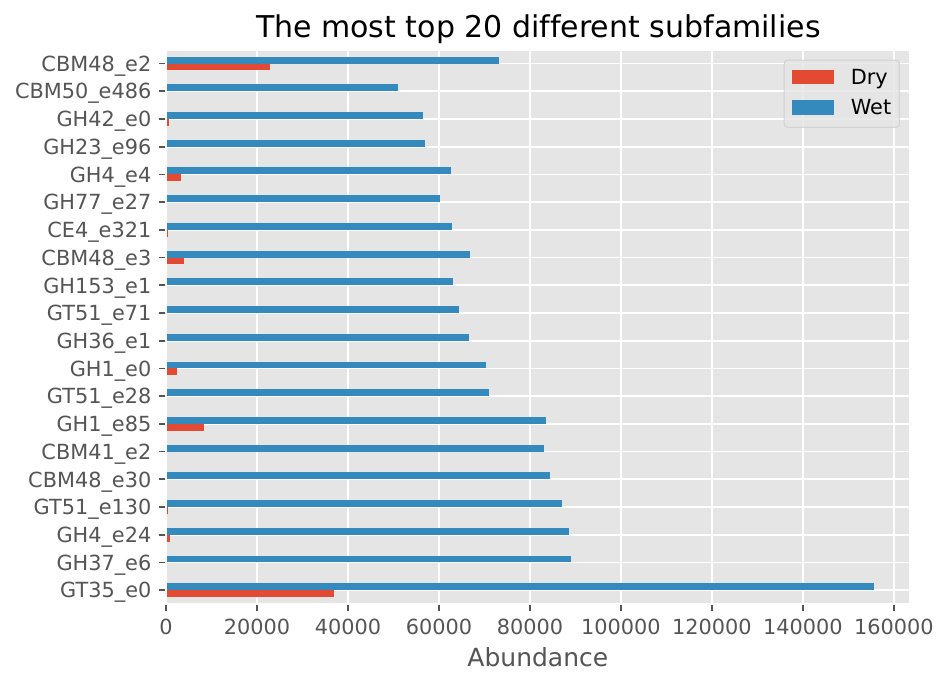
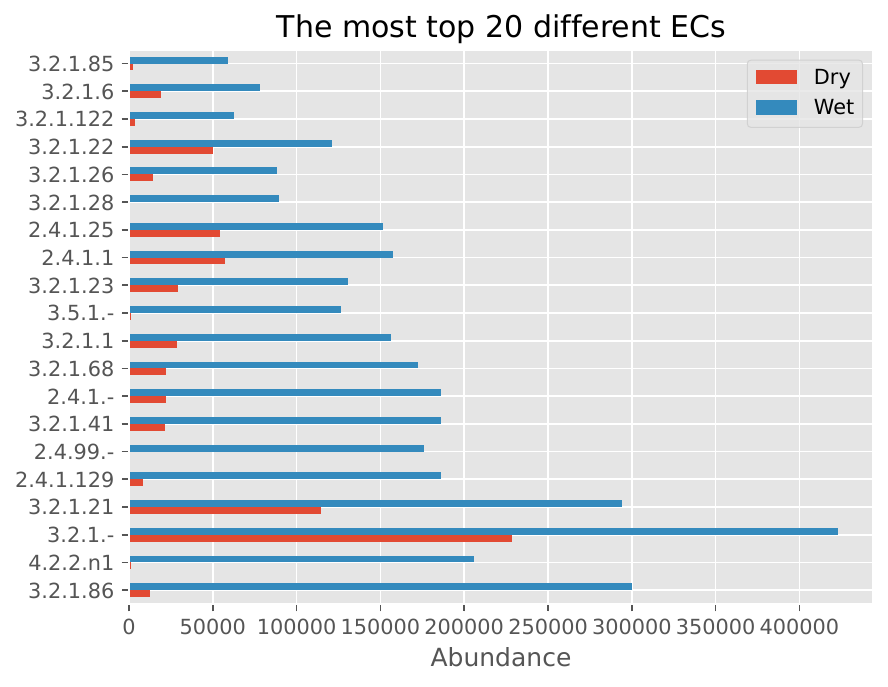
The following visualizations show example results from standard short reads analysis using two samples (Wet2014_dna and Dry2014_dna):
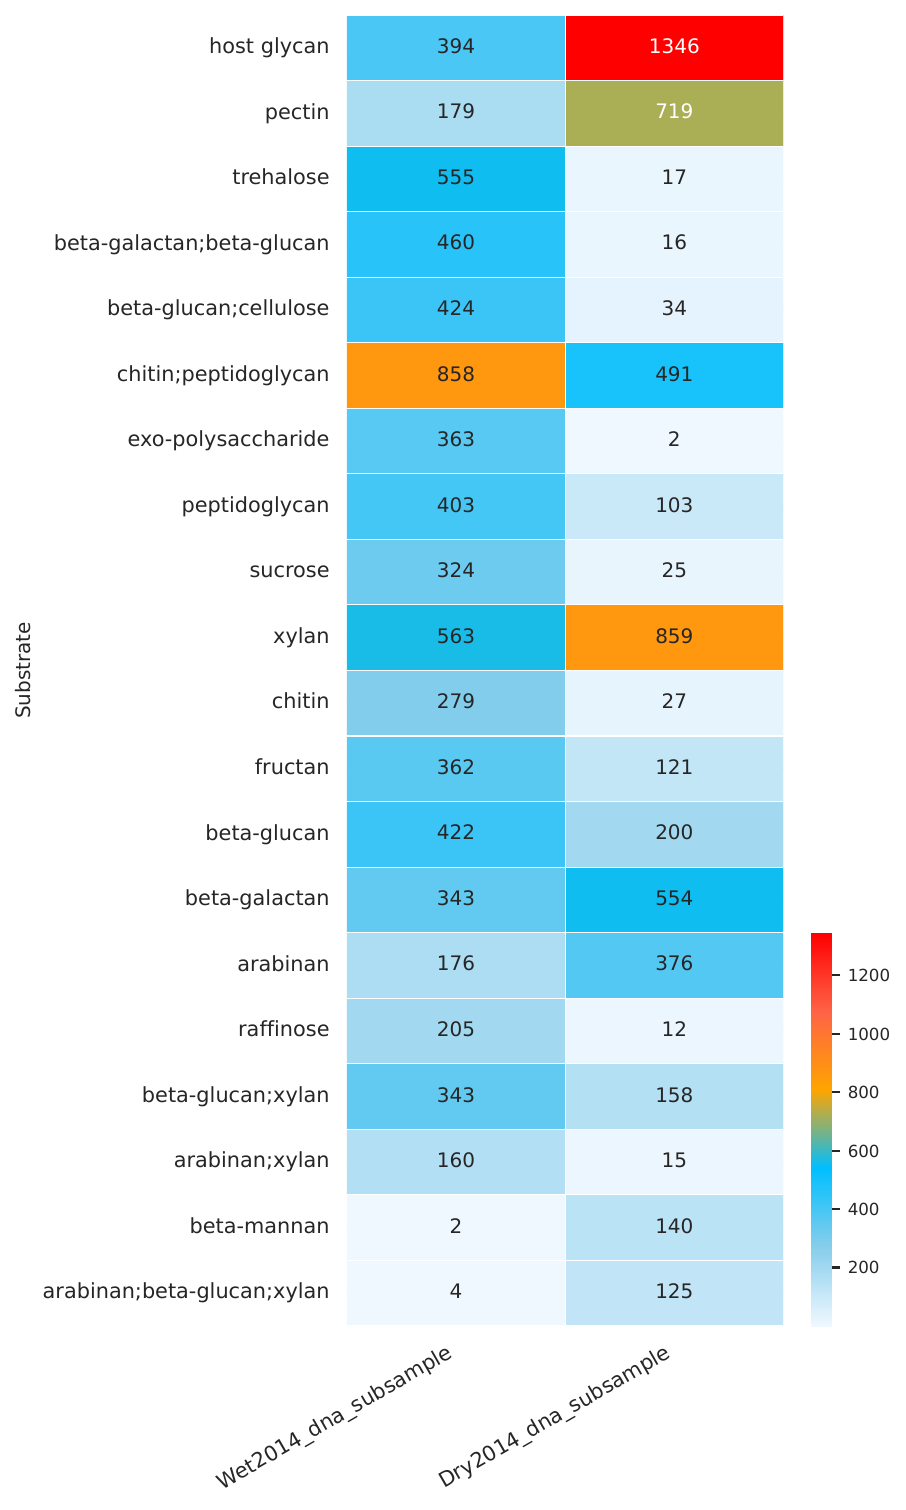
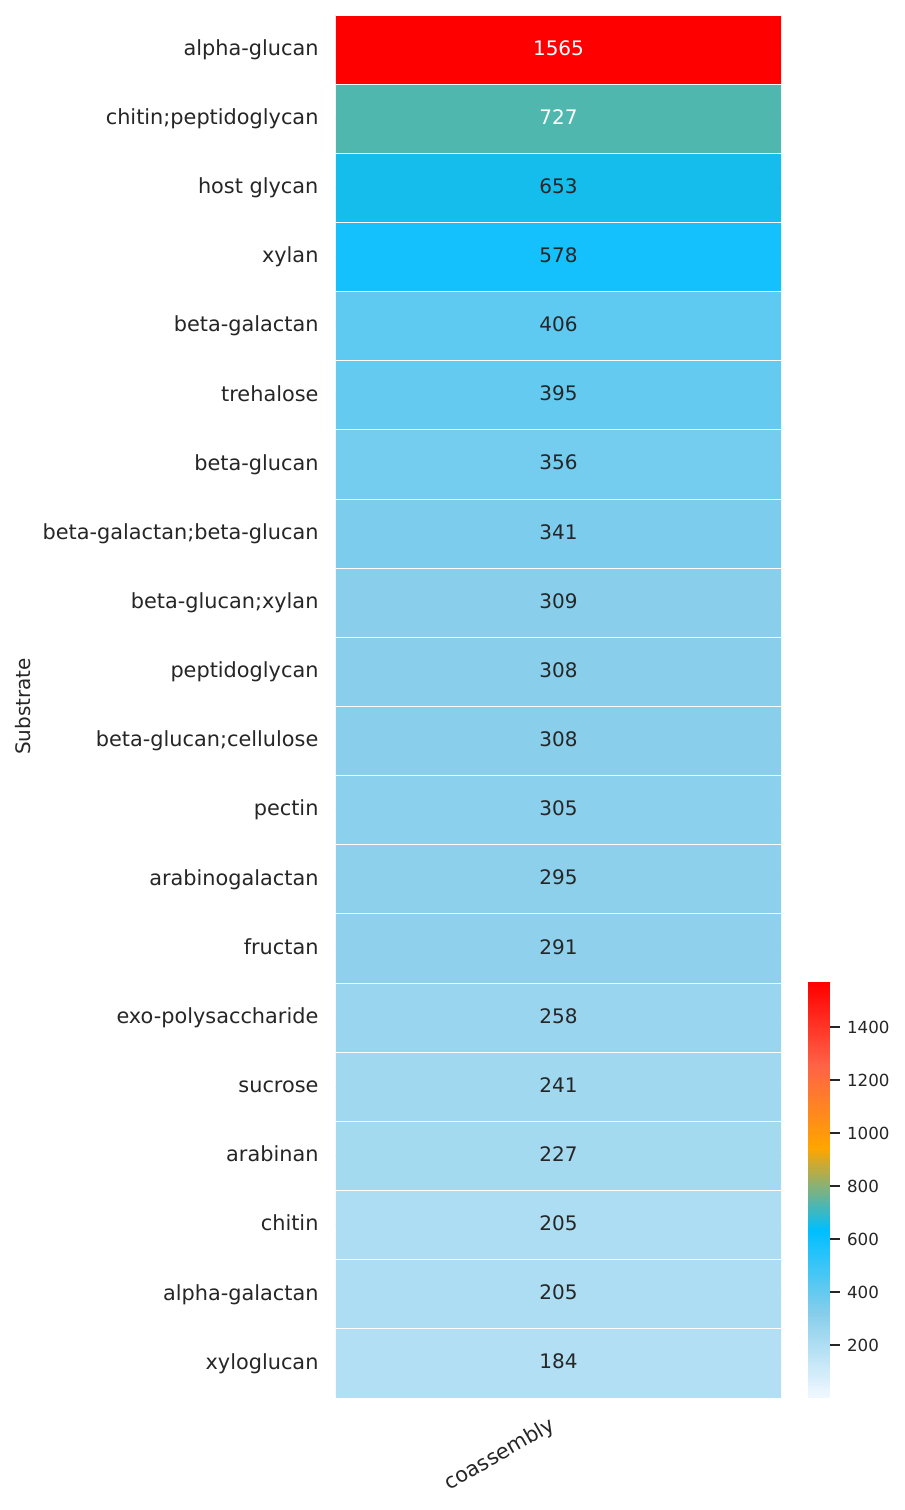
CAZyme Family Abundance Heatmap#
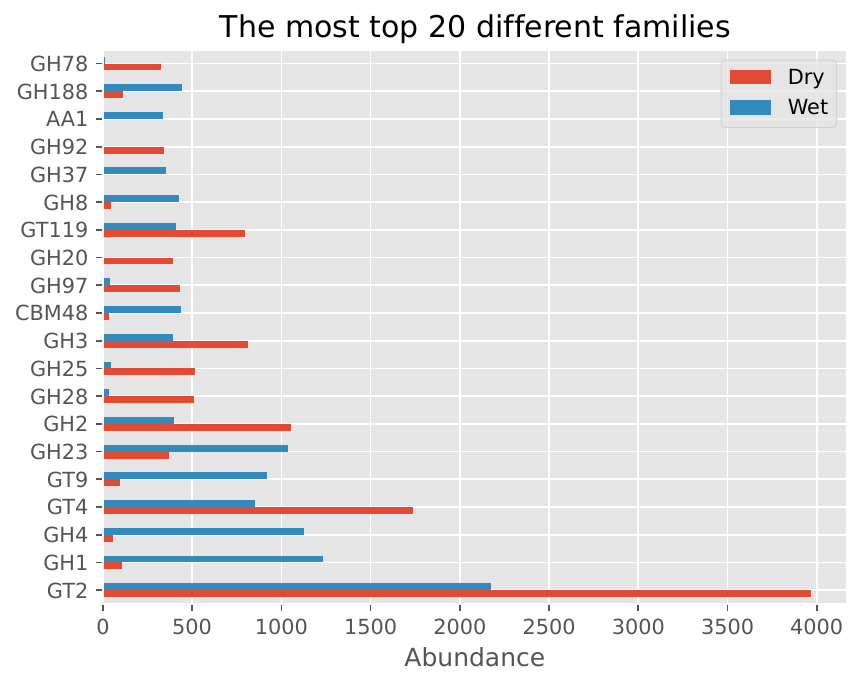
CAZyme Family Distribution#
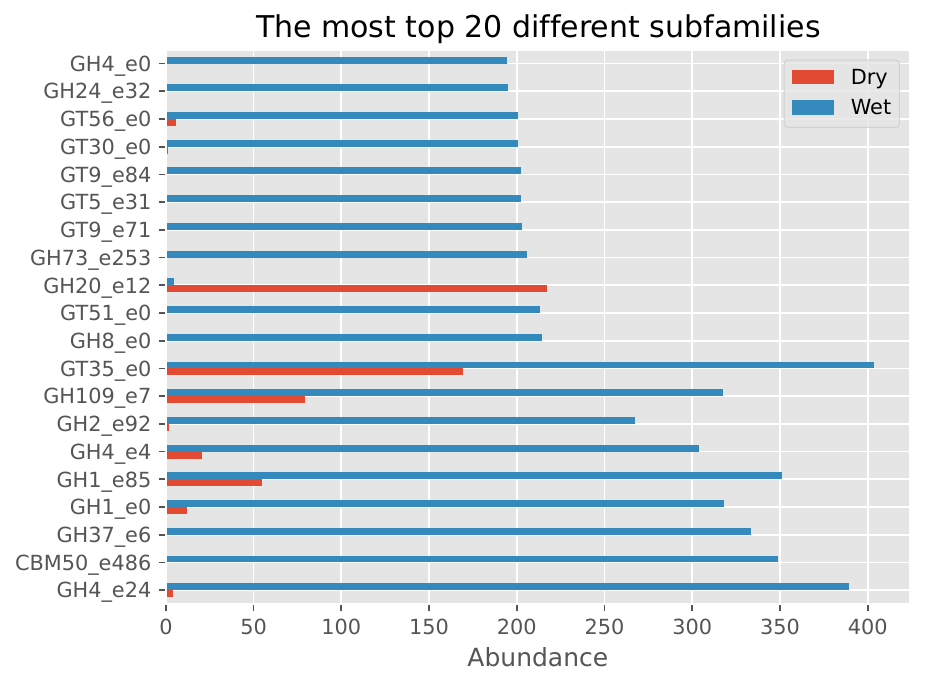
CAZyme Subfamily Distribution#
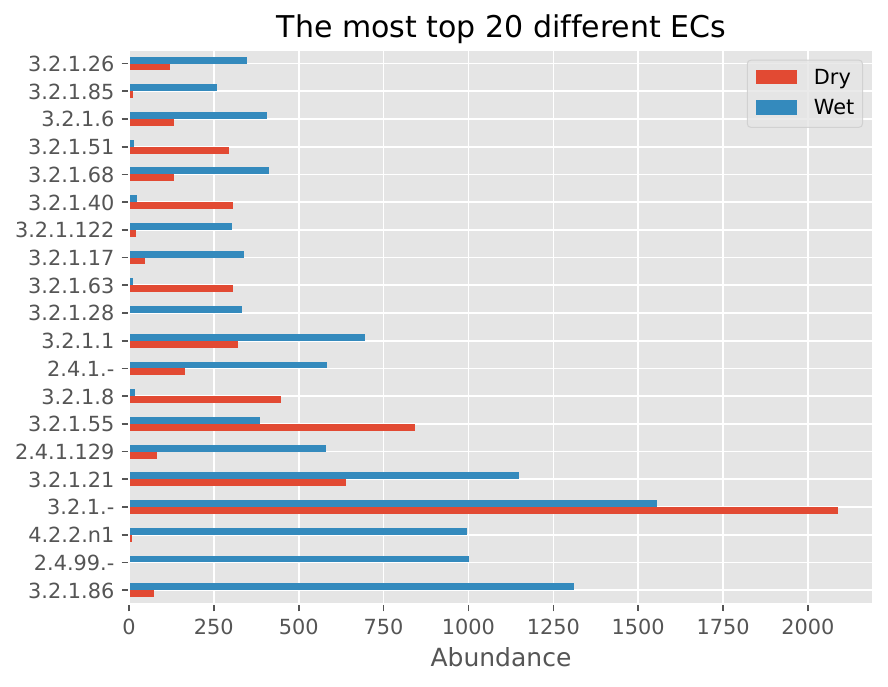
EC Number Distribution#
Short Reads Mode - Subsampling#
The following visualizations show example results from subsampling mode:
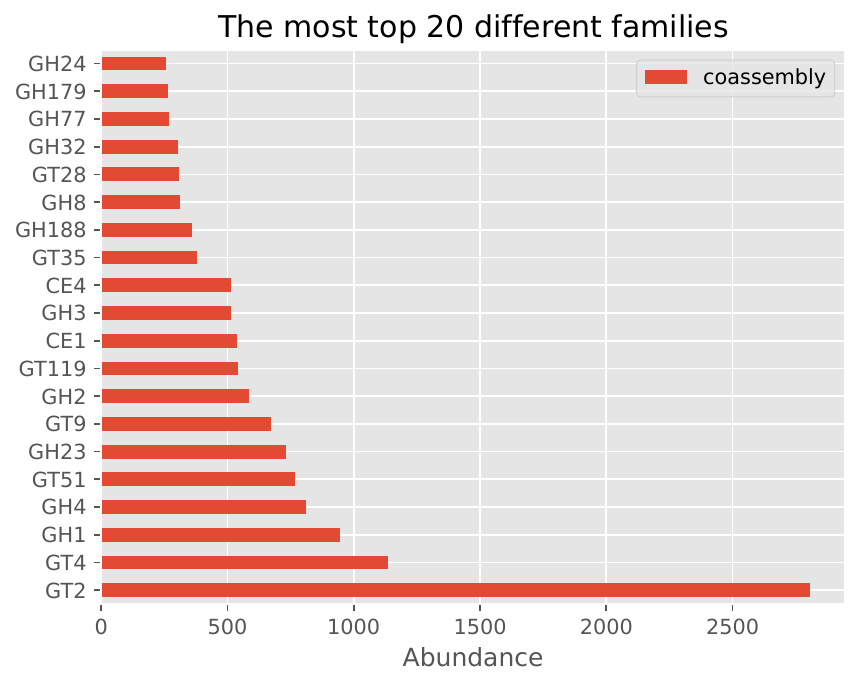
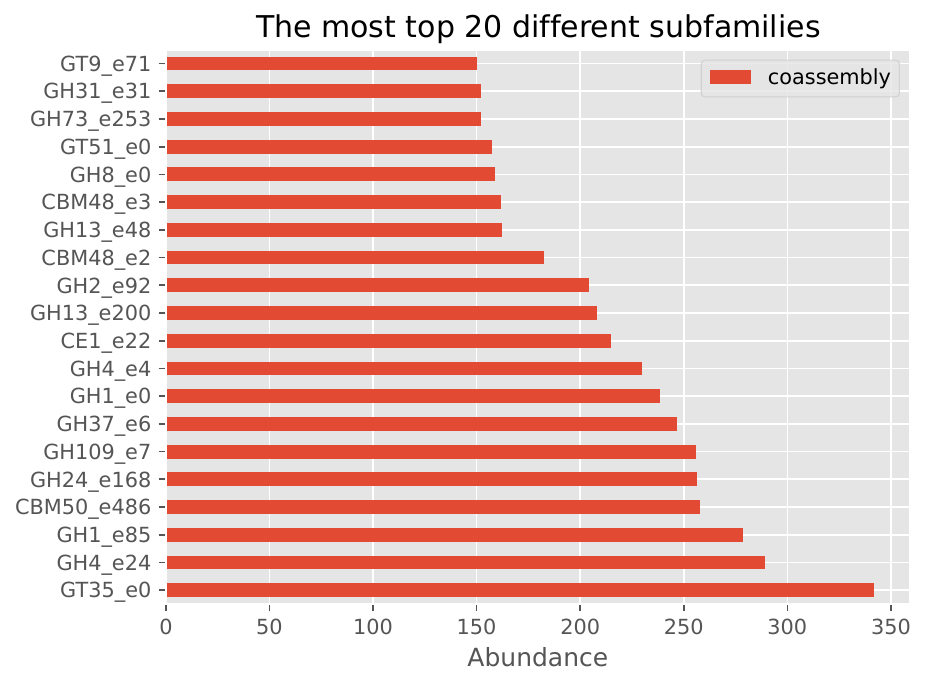
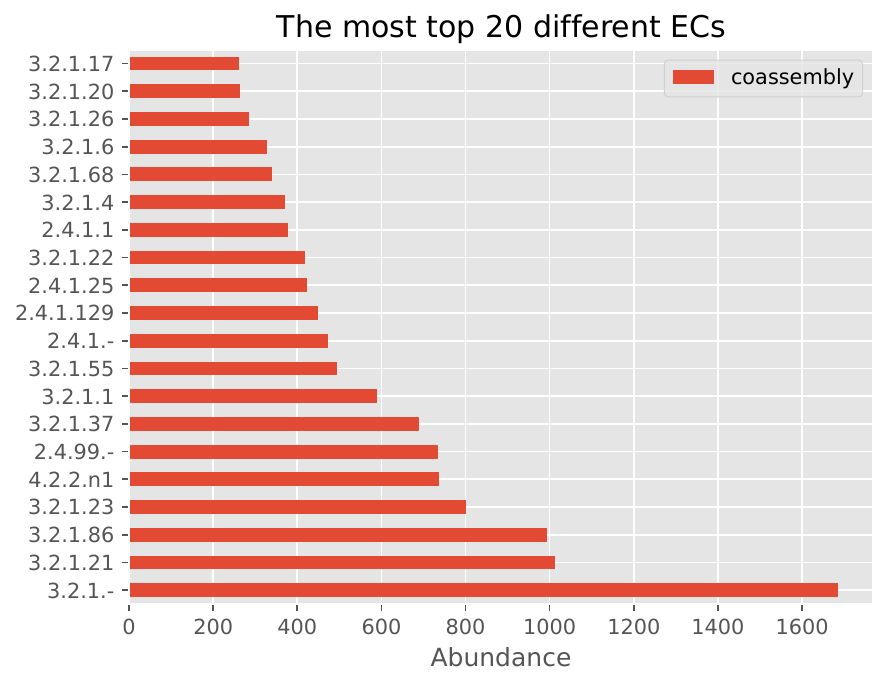
Short Reads Mode - Co-assembly#
The following visualizations show example results from co-assembly mode:
Assembly-Free Mode#
The following visualizations show example results from assembly-free mode:
Interpreting the Results#
The visualizations provided above demonstrate the comprehensive output of the Nextflow pipeline:
Heatmaps: Show the abundance of CAZyme families across different samples, allowing for easy comparison and identification of differentially abundant CAZymes.
Family/Subfamily Bar Plots: Display the distribution of CAZyme families and subfamilies, providing insights into the functional diversity of the microbiome.
EC Number Distribution: Shows the distribution of enzyme commission numbers, indicating the functional categories of CAZymes present in the samples.
Performance Metrics: The pipeline provides detailed statistics on computational requirements and result quality, helping users choose the most appropriate analysis mode for their datasets.
For more information about interpreting specific outputs, see the nextflow-output documentation.
See Also#
Short Reads Analysis Mode - Short reads mode documentation
Short Reads: Subsampling Mode - Subsampling mode documentation
Short Reads: Co-assembly Mode - Co-assembly mode documentation
Assembly-Free Analysis Mode - Assembly-free mode documentation
nextflow-output - Output documentation